Análisis Roll Rate mediante matrices de transición para el dataset Default of Credit Card Clients
Autor/a
Joel Burbano
Fecha de publicación
23 de agosto de 2024
Carga del dataset
Código
import pandas as pdimport numpy as npimport matplotlib.pyplot as pltimport seaborn as sbdf = pd.read_csv("UCI_Credit_Card.csv")df.head()
ID
LIMIT_BAL
SEX
EDUCATION
MARRIAGE
AGE
PAY_0
PAY_2
PAY_3
PAY_4
...
BILL_AMT4
BILL_AMT5
BILL_AMT6
PAY_AMT1
PAY_AMT2
PAY_AMT3
PAY_AMT4
PAY_AMT5
PAY_AMT6
default.payment.next.month
0
1
20000.0
2
2
1
24
2
2
-1
-1
...
0.0
0.0
0.0
0.0
689.0
0.0
0.0
0.0
0.0
1
1
2
120000.0
2
2
2
26
-1
2
0
0
...
3272.0
3455.0
3261.0
0.0
1000.0
1000.0
1000.0
0.0
2000.0
1
2
3
90000.0
2
2
2
34
0
0
0
0
...
14331.0
14948.0
15549.0
1518.0
1500.0
1000.0
1000.0
1000.0
5000.0
0
3
4
50000.0
2
2
1
37
0
0
0
0
...
28314.0
28959.0
29547.0
2000.0
2019.0
1200.0
1100.0
1069.0
1000.0
0
4
5
50000.0
1
2
1
57
-1
0
-1
0
...
20940.0
19146.0
19131.0
2000.0
36681.0
10000.0
9000.0
689.0
679.0
0
5 rows × 25 columns
Limpieza y Preparación de Datos
Código
print(df.isnull().sum())print(df.duplicated().sum())# df = df.drop_duplicates()print(df.info())# Las columnas PAY_i con i={0,2,3,...,6} representan el estado de pago del cliente# -1: Pago a tiempo, 0: Pago debido, 1: 1-30 diás moroso, .... , 8: 180 + días moroso# Estandarizamos estas categoriaspay_cols = ["PAY_"+str(i) for i in [0,2,3,4,5,6]]# Reemplazamos valores por categorías más fáciles de interpretardf[pay_cols] = df[pay_cols].replace({-2: 'No deuda',-1: 'Corriente', 0: 'Corriente',1: '1-30 días', 2: '31-60 días', 3: '61-90 días',4: '91-120 días', 5: '121-150 días',6: '151-180 días', 7: '180+ días', 8: '180+ días'})# Definir el orden deseado de los estados de pagoestado_pago_orden = ['No deuda', 'Corriente', '1-30 días', '31-60 días', '61-90 días', '91-120 días', '121-150 días', '151-180 días', '180+ días']for col in pay_cols: df[col]=pd.Categorical(df[col], categories= estado_pago_orden, ordered =True)
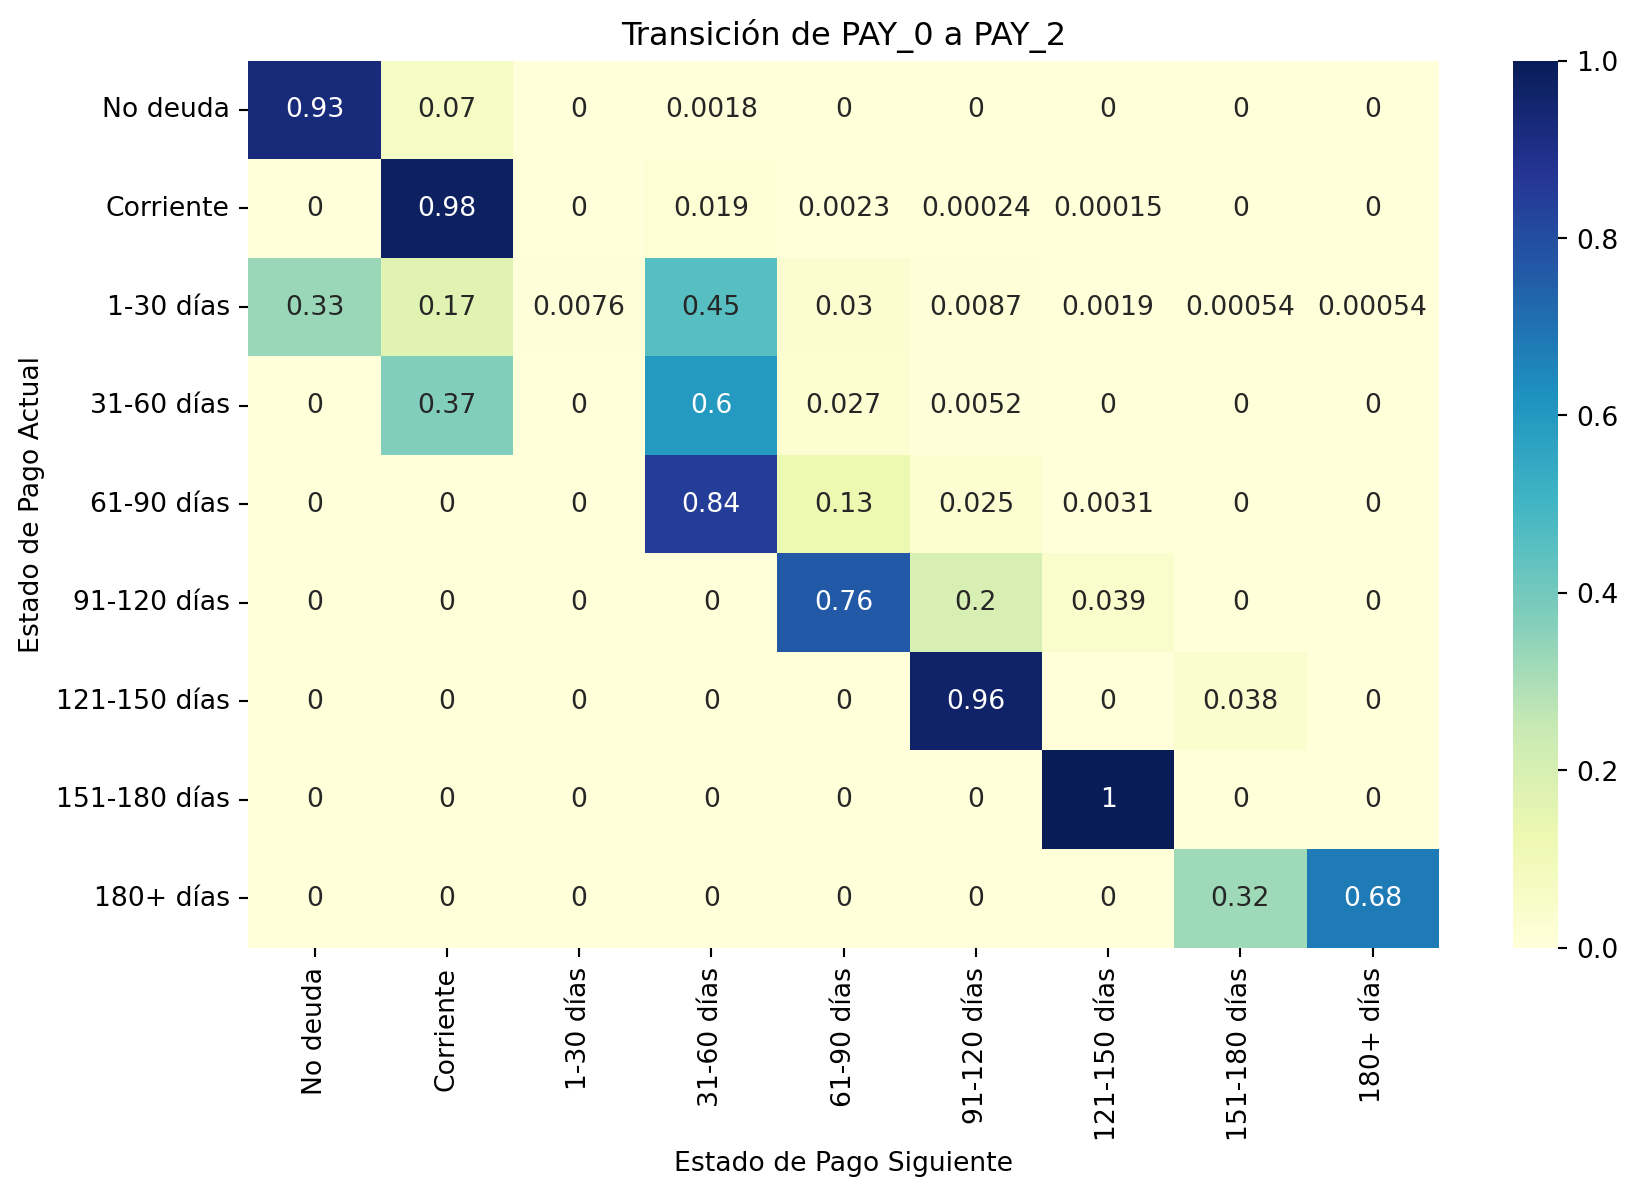
# Cálculo de las tasas de transición (Roll Rate)roll_rates = {}# Iteramos por pares de meses para calcular la tasa de transición entre estados de pagofor i inrange(len(pay_cols)-1): transition_matrix = pd.crosstab(df[pay_cols[i]], df[pay_cols[i+1]], normalize='index') label =f'Transición de {pay_cols[i]} a {pay_cols[i+1]}' roll_rates[label] = transition_matrix# Resumen de tasas de transiciónroll_rates['Transición de PAY_0 a PAY_2']
PAY_2
No deuda
Corriente
1-30 días
31-60 días
61-90 días
91-120 días
121-150 días
151-180 días
180+ días
PAY_0
No deuda
0.928235
0.069953
0.000000
0.001812
0.000000
0.000000
0.000000
0.000000
0.000000
Corriente
0.000000
0.978358
0.000000
0.018949
0.002301
0.000245
0.000147
0.000000
0.000000
1-30 días
0.331074
0.166757
0.007592
0.453362
0.029555
0.008677
0.001898
0.000542
0.000542
31-60 días
0.000000
0.371579
0.000000
0.596550
0.026622
0.005249
0.000000
0.000000
0.000000
61-90 días
0.000000
0.000000
0.000000
0.844720
0.127329
0.024845
0.003106
0.000000
0.000000
91-120 días
0.000000
0.000000
0.000000
0.000000
0.763158
0.197368
0.039474
0.000000
0.000000
121-150 días
0.000000
0.000000
0.000000
0.000000
0.000000
0.961538
0.000000
0.038462
0.000000
151-180 días
0.000000
0.000000
0.000000
0.000000
0.000000
0.000000
1.000000
0.000000
0.000000
180+ días
0.000000
0.000000
0.000000
0.000000
0.000000
0.000000
0.000000
0.321429
0.678571
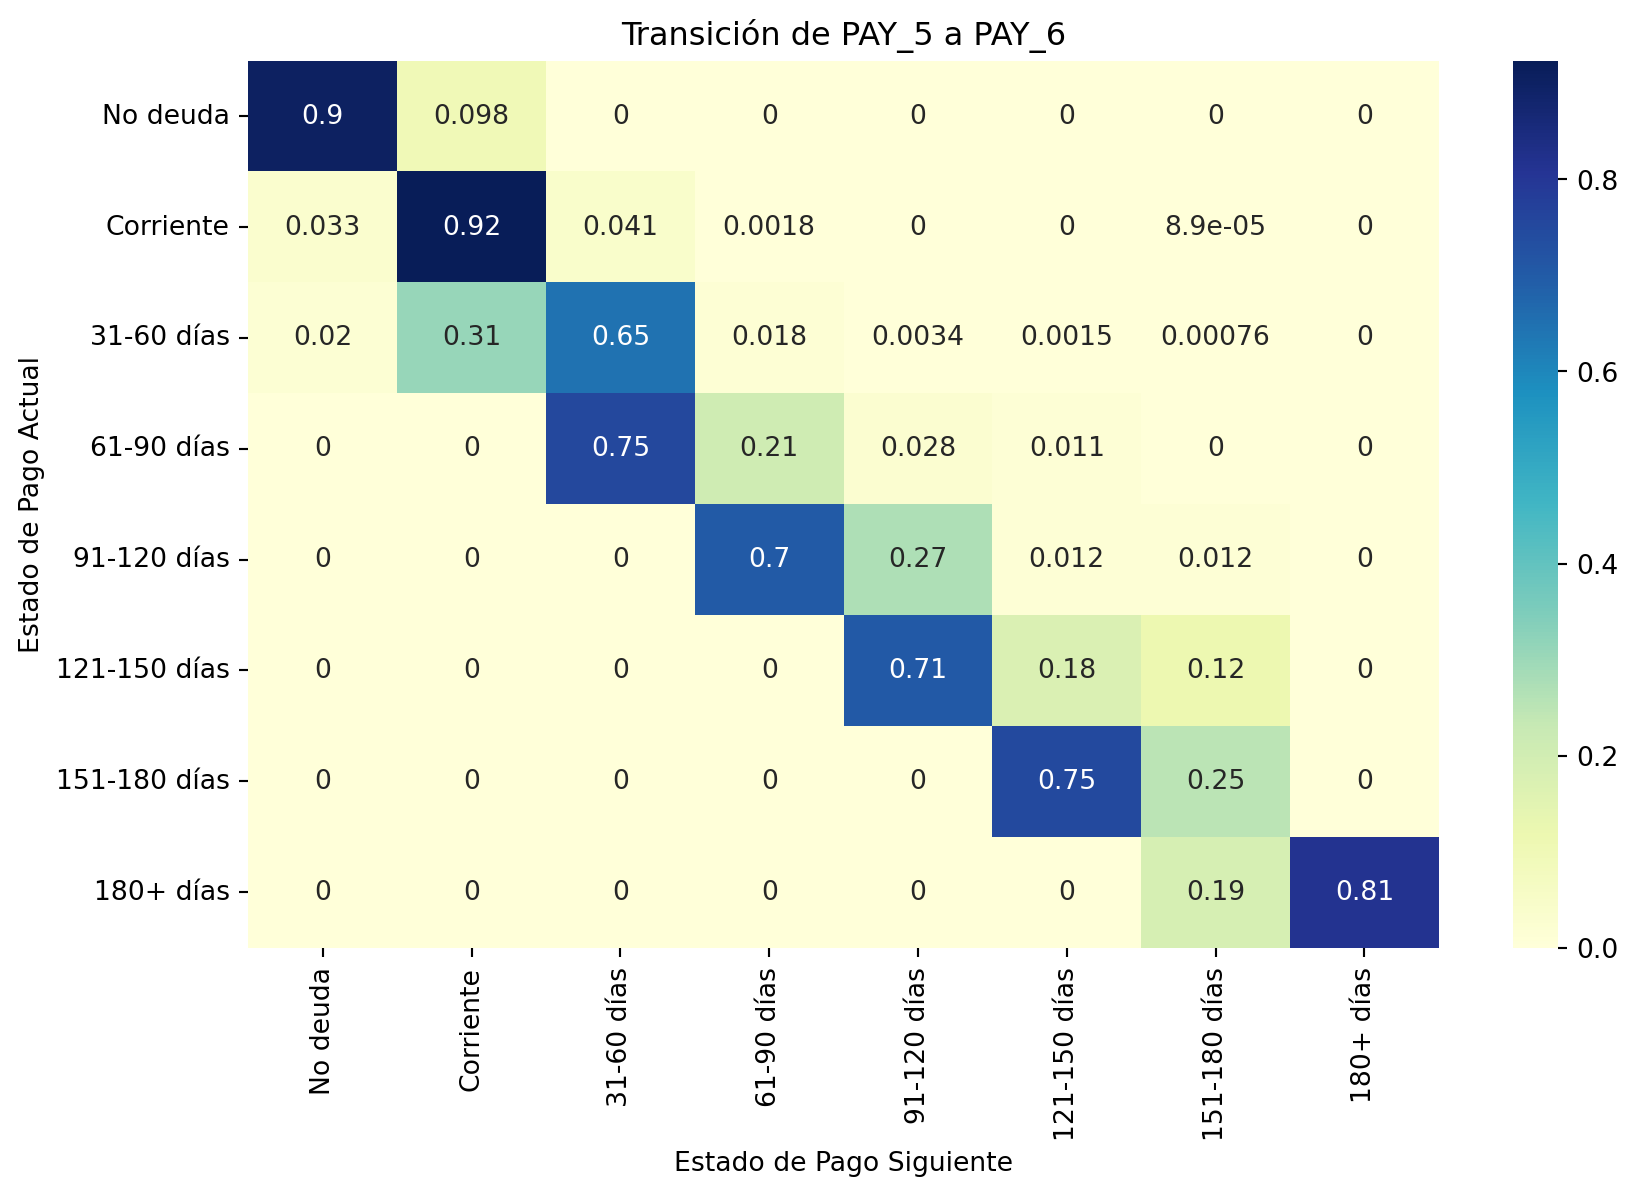
Visualización de Resultados
Código
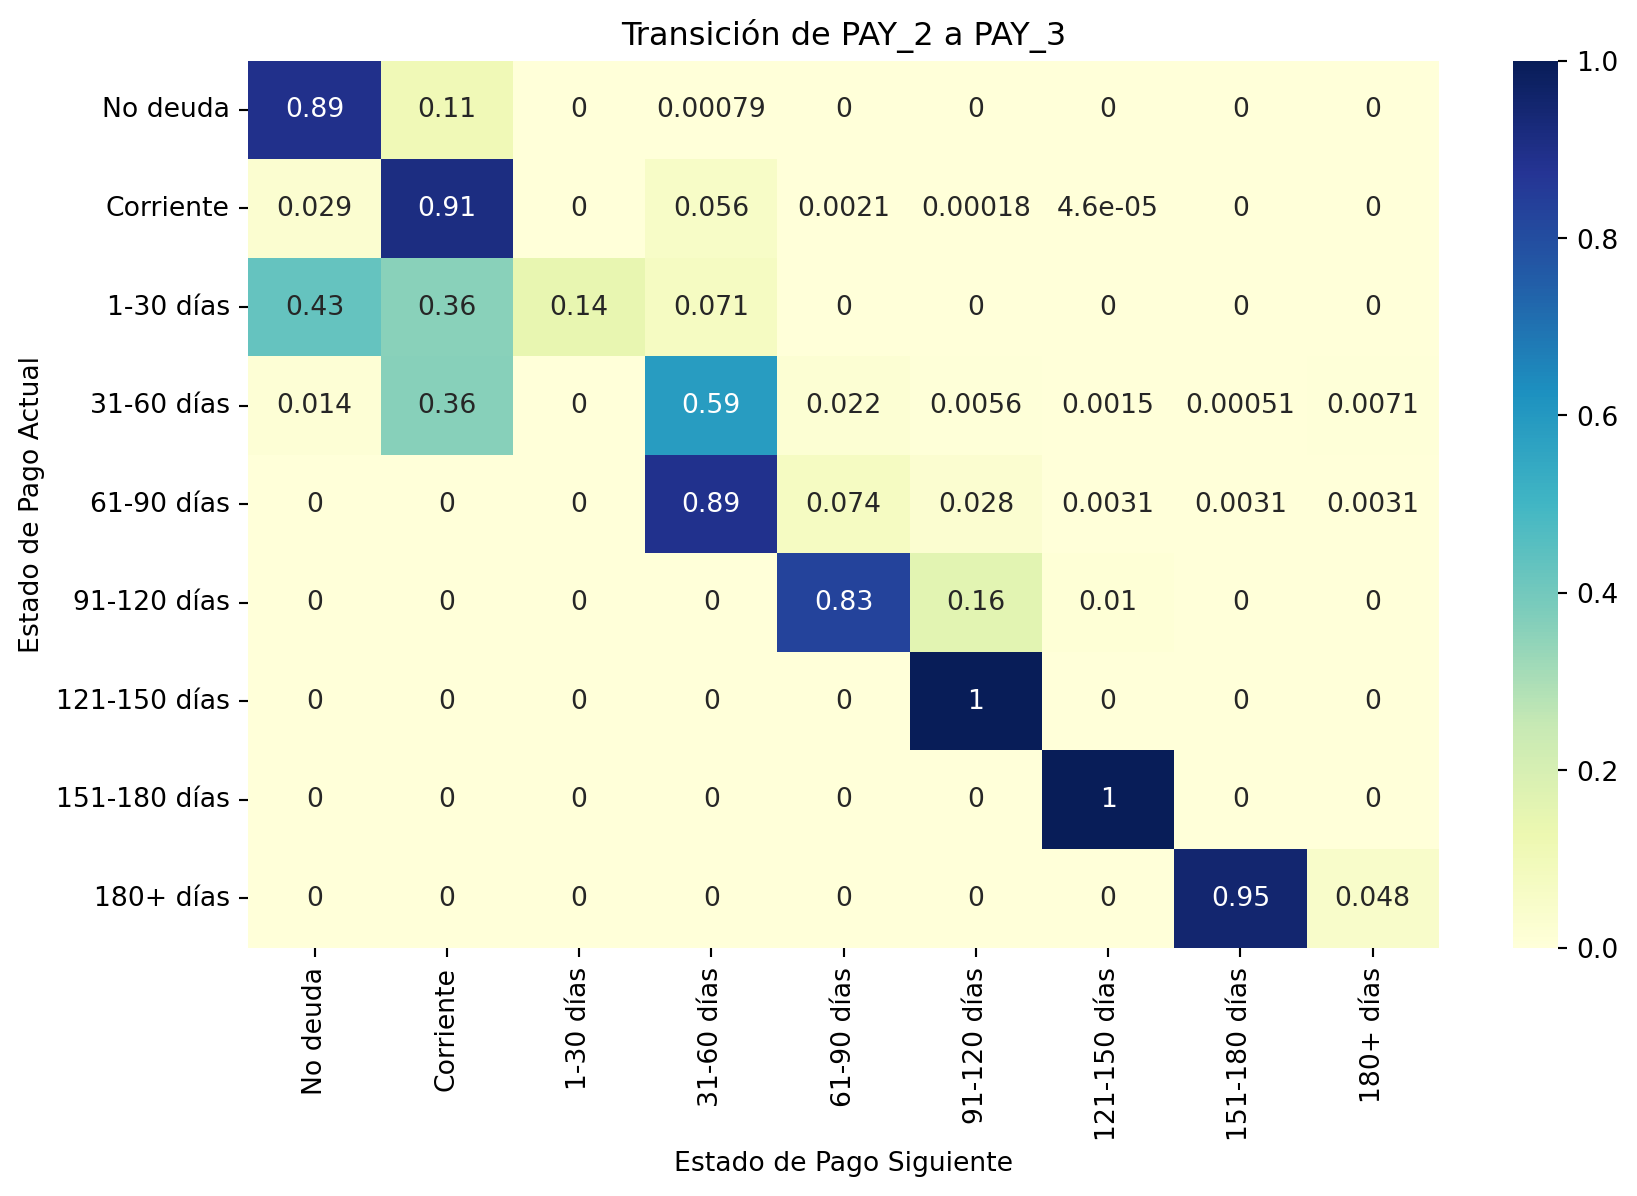
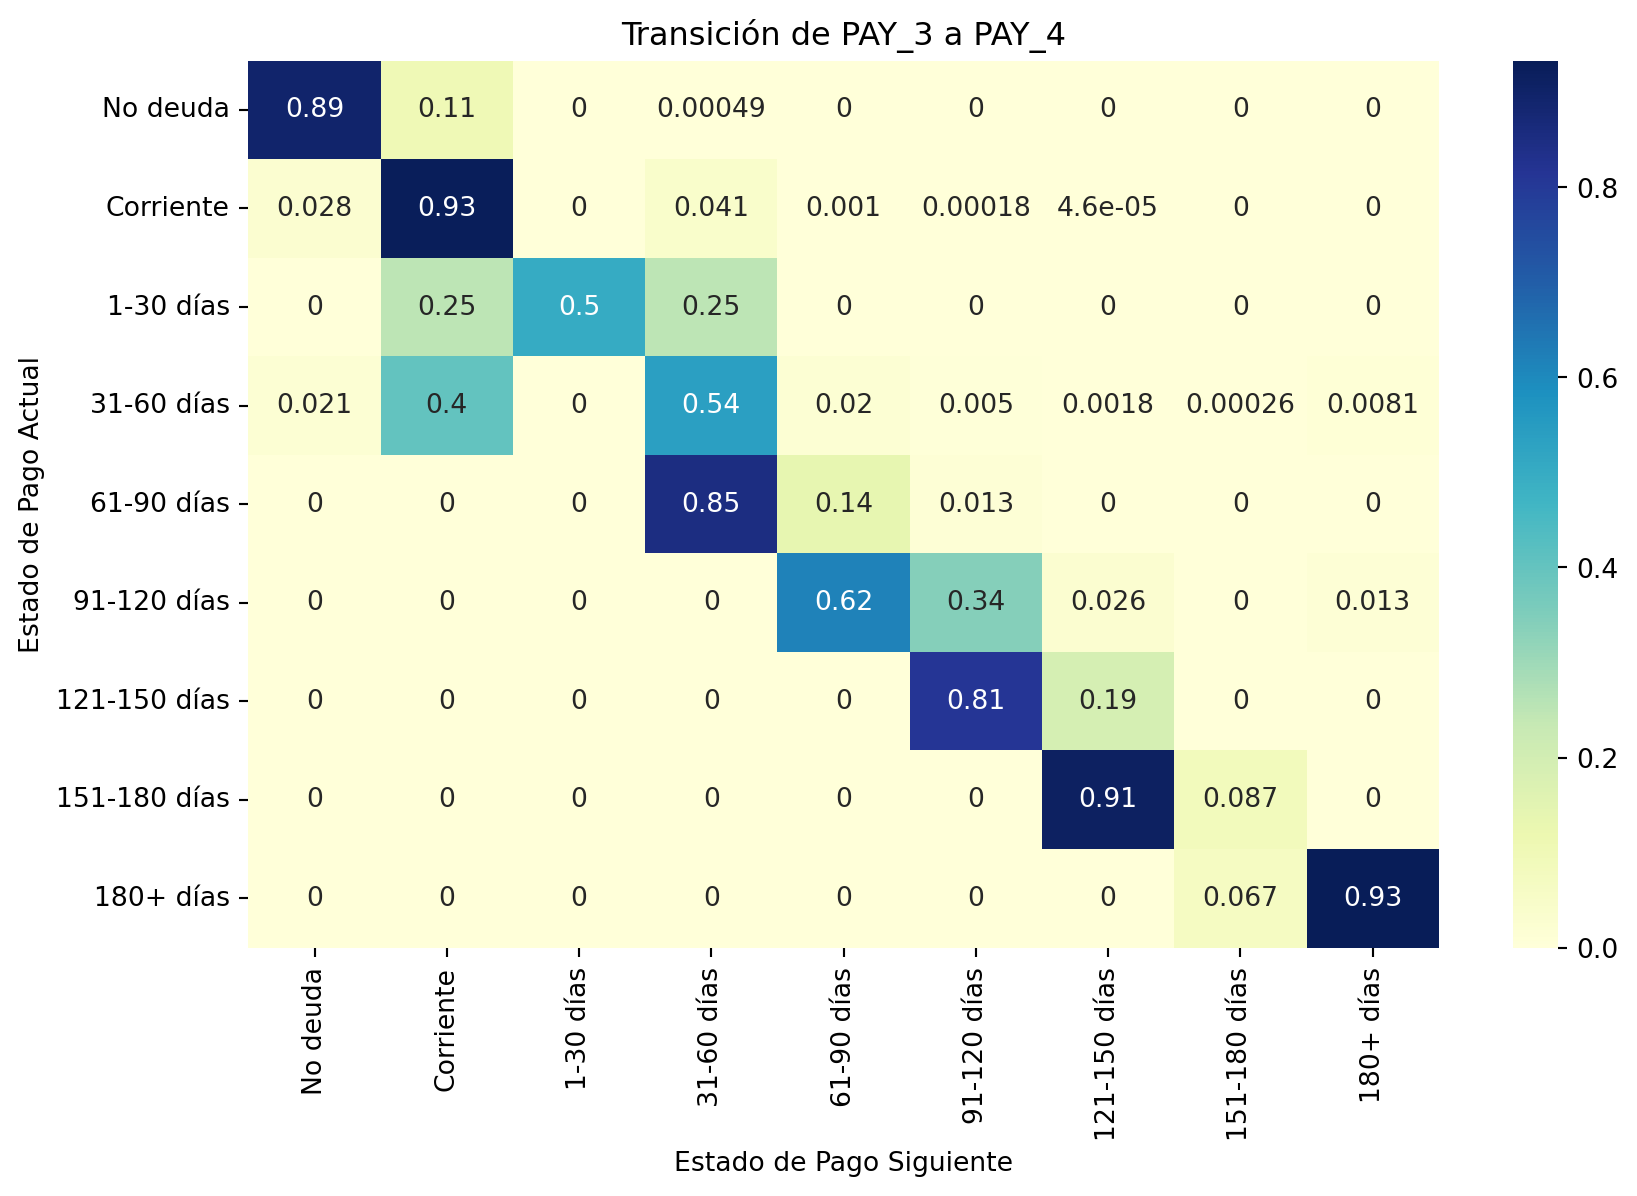
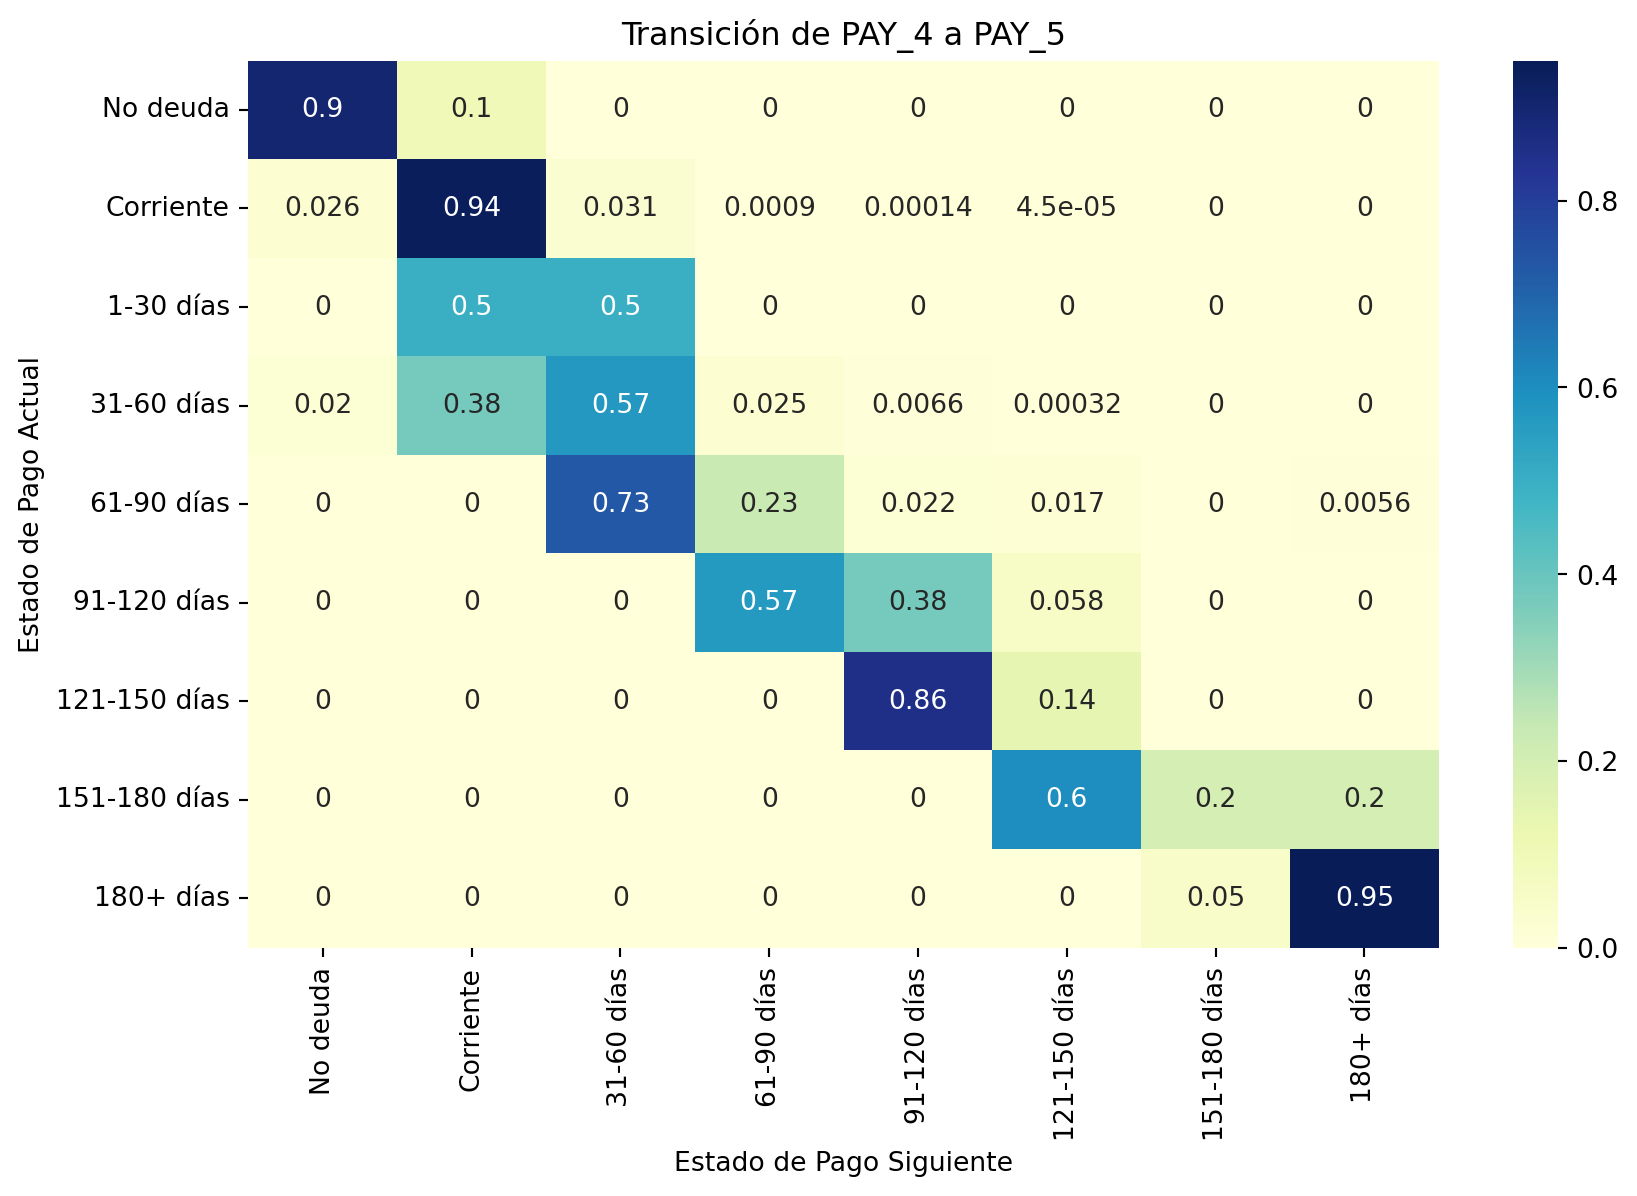
# Visualización de cada matriz de transición utilizando heatmapsfor label, matrix in roll_rates.items(): plt.figure(figsize= (10,6)) sb.heatmap(matrix, annot =True, cmap ="YlGnBu", cbar =True) plt.title(label) plt.xlabel('Estado de Pago Siguiente') plt.ylabel('Estado de Pago Actual') plt.show() plt.clf()
<Figure size 672x480 with 0 Axes>
<Figure size 672x480 with 0 Axes>
<Figure size 672x480 with 0 Axes>
<Figure size 672x480 with 0 Axes>
<Figure size 672x480 with 0 Axes>
Ejecutar el código
---title: Análisis Roll Rateauthor: Joel Burbanodate: 08-23-2024categories: [Python, Roll Rate]description: Análisis Roll Rate mediante matrices de transición para el dataset Default of Credit Card Clients---# Carga del dataset```{python}import pandas as pdimport numpy as npimport matplotlib.pyplot as pltimport seaborn as sbdf = pd.read_csv("UCI_Credit_Card.csv")df.head()```# Limpieza y Preparación de Datos```{python}print(df.isnull().sum())print(df.duplicated().sum())# df = df.drop_duplicates()print(df.info())# Las columnas PAY_i con i={0,2,3,...,6} representan el estado de pago del cliente# -1: Pago a tiempo, 0: Pago debido, 1: 1-30 diás moroso, .... , 8: 180 + días moroso# Estandarizamos estas categoriaspay_cols = ["PAY_"+str(i) for i in [0,2,3,4,5,6]]# Reemplazamos valores por categorías más fáciles de interpretardf[pay_cols] = df[pay_cols].replace({-2: 'No deuda',-1: 'Corriente', 0: 'Corriente',1: '1-30 días', 2: '31-60 días', 3: '61-90 días',4: '91-120 días', 5: '121-150 días',6: '151-180 días', 7: '180+ días', 8: '180+ días'})# Definir el orden deseado de los estados de pagoestado_pago_orden = ['No deuda', 'Corriente', '1-30 días', '31-60 días', '61-90 días', '91-120 días', '121-150 días', '151-180 días', '180+ días']for col in pay_cols: df[col]=pd.Categorical(df[col], categories= estado_pago_orden, ordered =True)```# Cálculo del Roll Rate```{python}# Cálculo de las tasas de transición (Roll Rate)roll_rates = {}# Iteramos por pares de meses para calcular la tasa de transición entre estados de pagofor i inrange(len(pay_cols)-1): transition_matrix = pd.crosstab(df[pay_cols[i]], df[pay_cols[i+1]], normalize='index') label =f'Transición de {pay_cols[i]} a {pay_cols[i+1]}' roll_rates[label] = transition_matrix# Resumen de tasas de transiciónroll_rates['Transición de PAY_0 a PAY_2']```# Visualización de Resultados```{python}# Visualización de cada matriz de transición utilizando heatmapsfor label, matrix in roll_rates.items(): plt.figure(figsize= (10,6)) sb.heatmap(matrix, annot =True, cmap ="YlGnBu", cbar =True) plt.title(label) plt.xlabel('Estado de Pago Siguiente') plt.ylabel('Estado de Pago Actual') plt.show() plt.clf()```